Formatting of Column/Bar Chart
Create Column/Bar Chart: This video contains how to format Column/Bar Chart in AIV.
Only users with Dashboard privilege have access to this section!
Read 5 minutes tutorial here.
The General tab shows the following options:
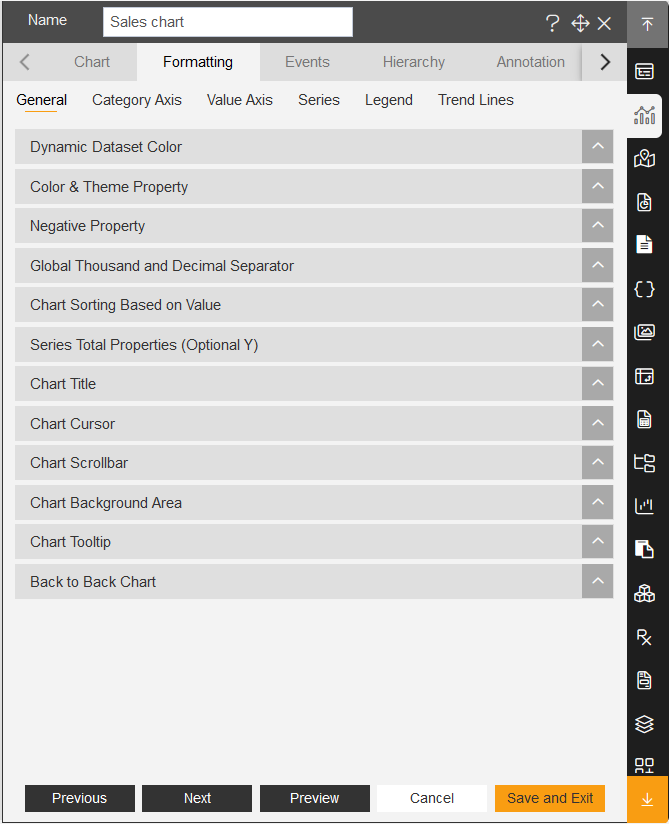
In the General tab, the user can change the appearance theme, can change the colour saturation, chart title, chart background-color, can add scroll bar in chart, and can make negative chart/Back to back chart.
Cursor behaviour can be changed by selecting the drop-down menu.
Chart Scrollbar can be adjusted by selecting the drop-down list.
Also, a value can be selected from value scrollbar the drop-down list.
The Category Axis tab includes following options.
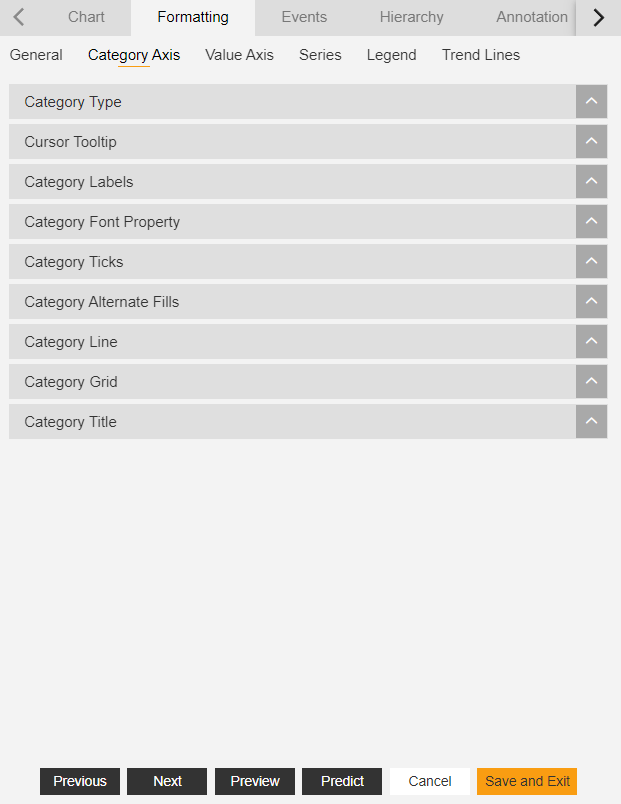
The User can change the X-axis type, min grid distance, cell start, and end location, min-max label position, the user can wrap and truncate if overlapping issues arise.
The User can also change the axis colour, line colour, and grid colour.
The Value Axis tab includes the following options:
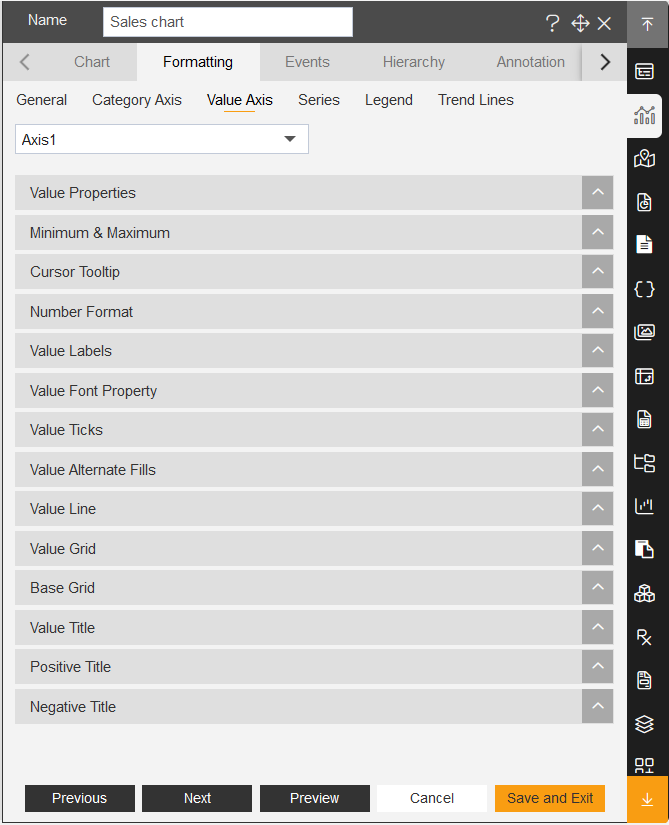
Here, the user can change the widget properties, can change the grid properties, can change the label properties, also can do the title formatting.
The series tab includes the following options:
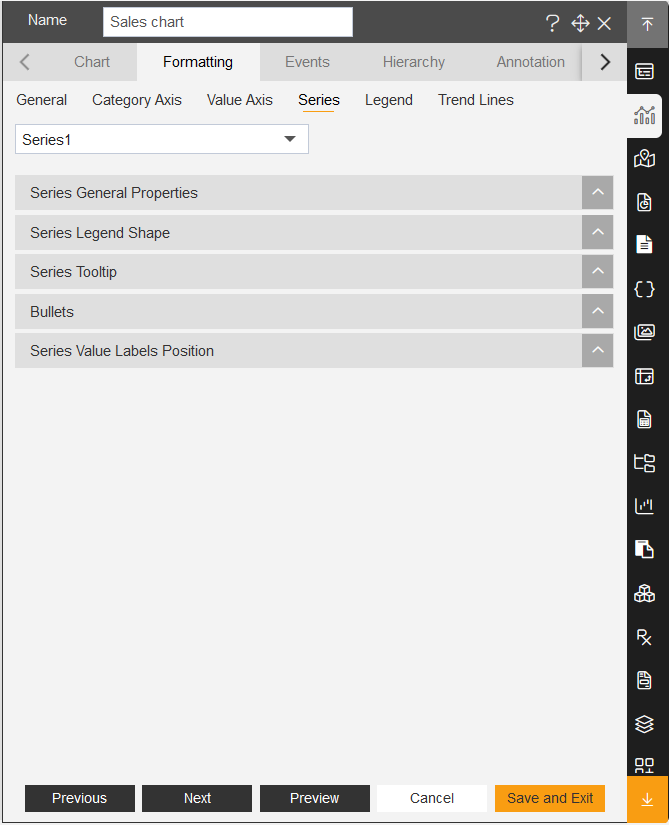
Here, the user can change the series type, series name, opacity, series’ label properties, tooltips, ticks and so on.
The Legend Property tab includes following options:
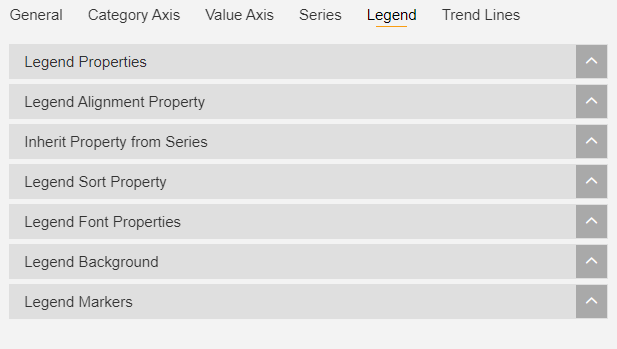
Here, user can change the legend by using Legend Property, Legend Alignment, Legend Background, Legend Markers and so on.
✒️ To know more about other formatting properties click on below links:-
1. General Properties
2. Category Axis Properties
3. Value Axis Properties
4. Series Properties
5. Legend Properties
6. Trend Line
✒️ In order to understand in detail about Line/Area Chart, click on the following links:-